

The Relationship Between Air Quality Monitors and Demographics
Everyone loves a public good, and one of the classic examples is clean air. When I breathe in clean air, no one else gets any less of it, and you can’t exclude people from enjoying it.
But how do we know whether the air we’re breathing is clean? And is that information a public good?
Economists Study Air Quality Monitors and Demographics
A team of economists from universities across the U.S. published some answers to those questions this week in a working paper via the National Bureau of Economic Research.
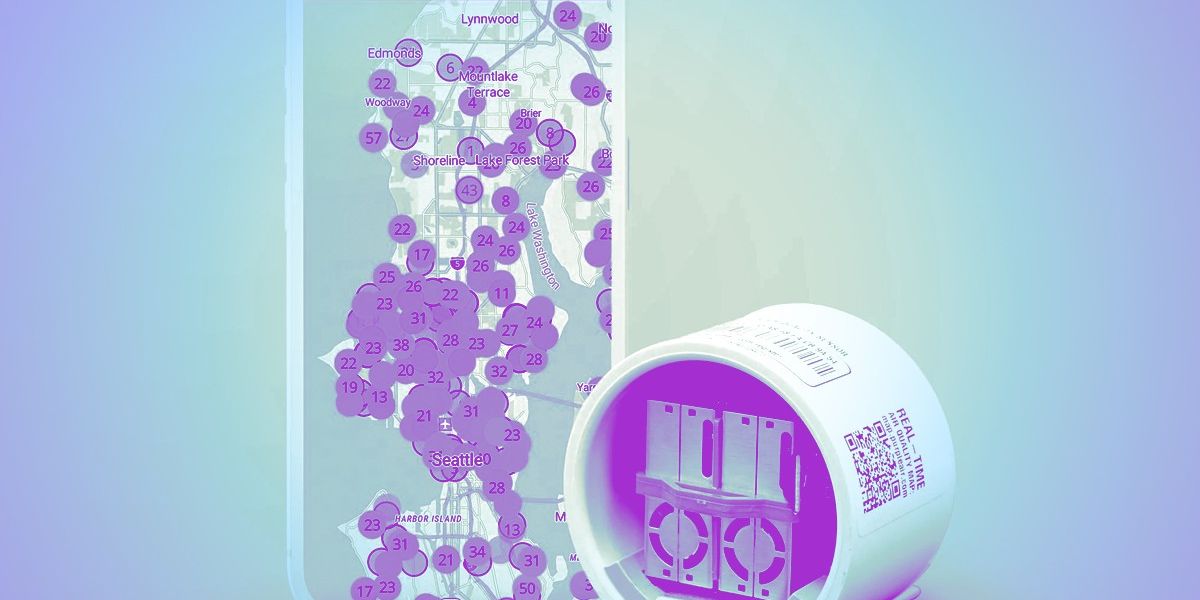
As their research subject, the economists looked at PurpleAir, which promises more localized and frequently updated air quality readings beyond what the Environmental Protection Agency can provide. Once purchased (for a price of $229 to $339, depending on the model) and installed, the censors report their air quality readings to a map that anyone can access. The company’s sales took off in 2020 after the epochal wildfires up and down the West Coast.
The study considered air quality readings from PurpleAir monitors in California from 2019 to 2021, including the fires and the consumer response to them. Then the researchers matched those readings with census tracts and the demographic information associated with them.
What they found is that PurpleAir monitors tend to be “clustered” within certain geographic areas, and that those geographic areas tend to be wealthier. Not surprisingly, pricey air monitors have a customer base demographically similar to that of other gadgets bought by early adopters. In other words, PurpleAir monitors’ locations don’t so much track pollution levels as demographics.
On Thursday afternoon, the PurpleAir map showed 15 outdoor sensors in and around Bakersfield, California, a majority Hispanic city of 400,000 people in California’s Central Valley that the American Lung Association ranks as either the most or the third most polluted American city, depending on the metric. There were 13 active, meanwhile, in the famously ritzy San Francisco neighborhood of Pacific Heights, with a population of around 20,000. (We reached out for comment to both the researchers and PurpleAir but hadn’t gotten a response from either as of press time.)
Of course, the relationship between income and pollution is not random — quite the opposite. On the global and national levels, there is an inverse relationship between air pollution and income, with people in low income areas more exposed to harmful pollution.
Implications for Health Inequalities and SDGs
While the economists called their finding “unsurprising,” they also said it raised the concern that the monitors “may actually increase health inequalities” by allowing people in better-covered areas to “improve their health through avoidance behavior,” thus making it so “the benefit from these monitors are more likely to accrue to the higher income individuals that adopted them.” Since PurpleAir monitors “are more present in less polluted areas,” the data they collect has less “social value … since the places that would benefit the most from information that could encourage pollution avoidance behavior are precisely the ones least likely to have this information.”
This means that “in areas where pollution is the highest, and thus avoidance behaviors are potentially the most effective, people have less knowledge of their pollution levels, even when conditioning on income and education.”
The researchers found similar correlations of PurpleAir monitor usage and race, with “monitor adoption … lowest in areas with a higher share of Black or Hispanic populations.”
These findings also mean that the people spending money to learn about the air quality where they live are also getting very little value from their monitors, as they are both less likely to live in a heavily polluted area and more likely to be well served by existing air monitors. In the slightly bloodless language of academic economics, the authors wrote, “Technophiles may purchase monitors for reasons that are quasi-independent from the value of information that the monitor provides, including a competitive desire to ‘keep up with the Joneses’ and thus drive high levels of spatial correlation in monitor adoption.” If people are getting PurpleAir monitors because their neighbors are, it’s probably a sign that they don’t need one.
For the public to truly realize the promise of more particularized and frequently updated public health data, collection can’t merely be left up to the vagaries and patterns of the consumer electronics market. An “optimal” policy, according to the researchers, “will require supplemental provision of monitors where the private market falls short” — or to put it more bluntly, government action. Public health will have to be public.
SDGs, Targets, and Indicators
1. Which SDGs are addressed or connected to the issues highlighted in the article?
- SDG 3: Good Health and Well-being
- SDG 10: Reduced Inequalities
- SDG 11: Sustainable Cities and Communities
The article addresses issues related to air quality, health inequalities, and the need for public provision of monitors, which are connected to the above-mentioned SDGs.
2. What specific targets under those SDGs can be identified based on the article’s content?
- SDG 3.9: By 2030, substantially reduce the number of deaths and illnesses from hazardous chemicals and air, water, and soil pollution and contamination.
- SDG 10.2: By 2030, empower and promote the social, economic, and political inclusion of all, irrespective of age, sex, disability, race, ethnicity, origin, religion, or economic or other status.
- SDG 11.6: By 2030, reduce the adverse per capita environmental impact of cities, including by paying special attention to air quality and municipal and other waste management.
The article highlights the need to address air pollution-related health issues (SDG 3.9), the disparities in access to air quality information based on income and race (SDG 10.2), and the importance of improving air quality in cities (SDG 11.6).
3. Are there any indicators mentioned or implied in the article that can be used to measure progress towards the identified targets?
Yes, there are indicators mentioned in the article that can be used to measure progress towards the identified targets:
- Number of deaths and illnesses related to air pollution (SDG 3.9)
- Level of income and demographic characteristics associated with access to air quality monitors (SDG 10.2)
- Presence and distribution of air quality monitors in different areas, particularly in heavily polluted areas (SDG 11.6)
The article discusses the correlation between income, race, and access to air quality monitors, which can serve as indicators for measuring progress towards reducing health inequalities and improving air quality.
4. Table: SDGs, Targets, and Indicators
| SDGs | Targets | Indicators |
|---|---|---|
| SDG 3: Good Health and Well-being | 3.9: By 2030, substantially reduce the number of deaths and illnesses from hazardous chemicals and air, water, and soil pollution and contamination. | Number of deaths and illnesses related to air pollution |
| SDG 10: Reduced Inequalities | 10.2: By 2030, empower and promote the social, economic, and political inclusion of all, irrespective of age, sex, disability, race, ethnicity, origin, religion, or economic or other status. | Level of income and demographic characteristics associated with access to air quality monitors |
| SDG 11: Sustainable Cities and Communities | 11.6: By 2030, reduce the adverse per capita environmental impact of cities, including by paying special attention to air quality and municipal and other waste management. | Presence and distribution of air quality monitors in different areas, particularly in heavily polluted areas |
The table presents the identified SDGs, their corresponding targets, and the specific indicators mentioned in the article that can be used to measure progress towards those targets.
Copyright: Dive into this article, curated with care by SDG Investors Inc. Our advanced AI technology searches through vast amounts of data to spotlight how we are all moving forward with the Sustainable Development Goals. While we own the rights to this content, we invite you to share it to help spread knowledge and spark action on the SDGs.
Fuente: heatmap.news
![]()
Join us, as fellow seekers of change, on a transformative journey at https://sdgtalks.ai/welcome, where you can become a member and actively contribute to shaping a brighter future.


