Los Angeles has the worst ozone pollution in the nation
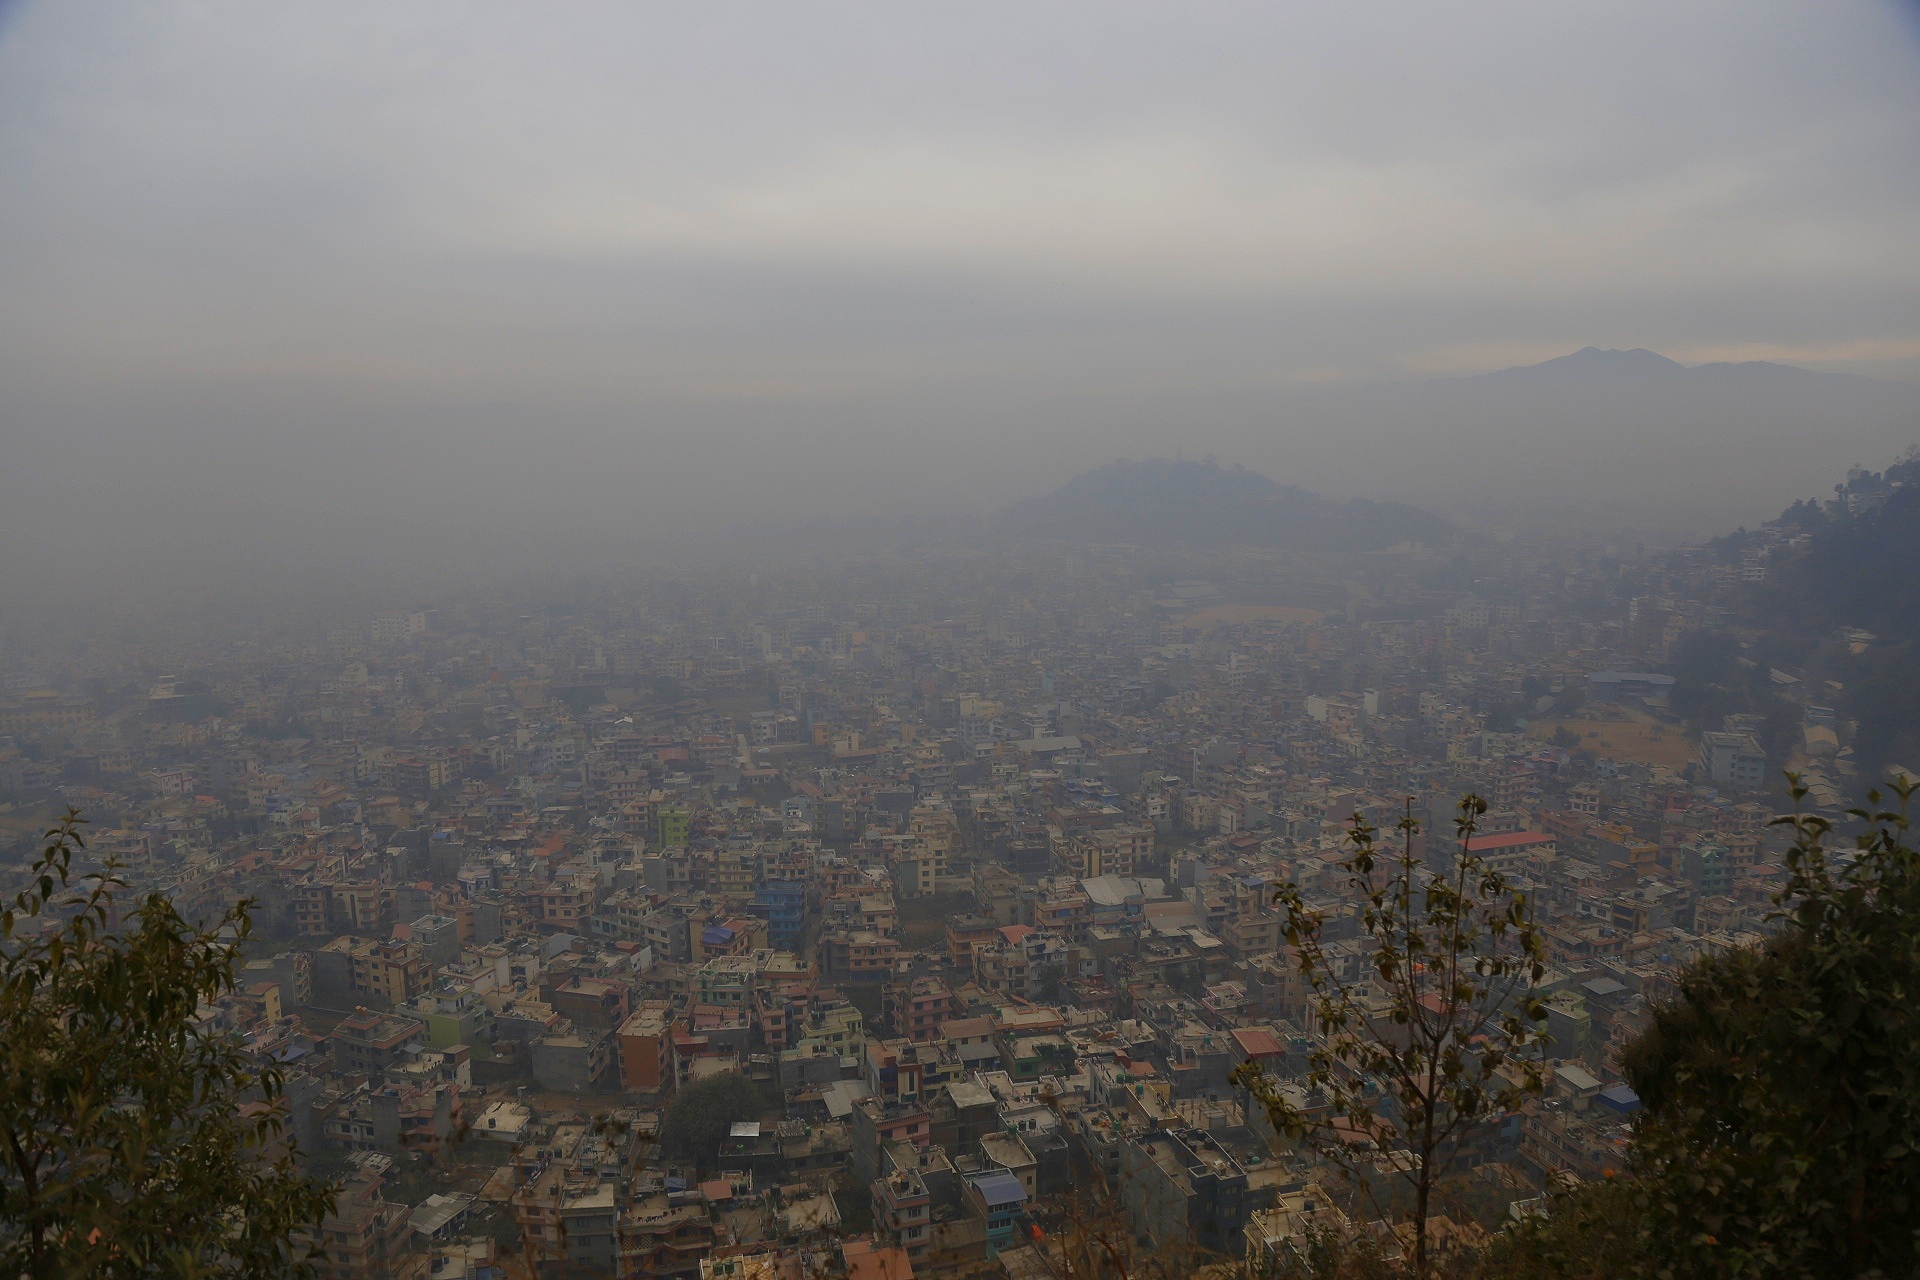
According to an annual report by the American Lung Association, Los Angeles has the worst ozone pollution in the nation. The area also received failing grades for high particulate matter. The report, titled “State of the Air,” found that nearly 4 in 10 people live in an area that received a failing grade for at least one measure of air pollution. Cities in the western U.S. dominated the list.
California had the most metro areas on the list, with 10 of the 25 most polluted cities in the country. After the Los Angeles metro area, the top ozone-polluted cities include Visalia, Bakersfield, and the Fresno area, followed by Phoenix, Arizona.
What is ozone?
Ozone is a gas found in the Earth’s atmosphere. High above us in the stratosphere, the ozone layer is beneficial, absorbing some of the sun’s harmful UV radiation and preventing it from reaching Earth’s surface. However, ozone pollution, which occurs when emissions react under heat and sunlight, is harmful to our health. It produces ground-level ozone, also known as smog, which can damage the respiratory tract and lungs, resulting in symptoms such as coughing, chest tightness, and worsening of asthma.
What causes ozone pollution?
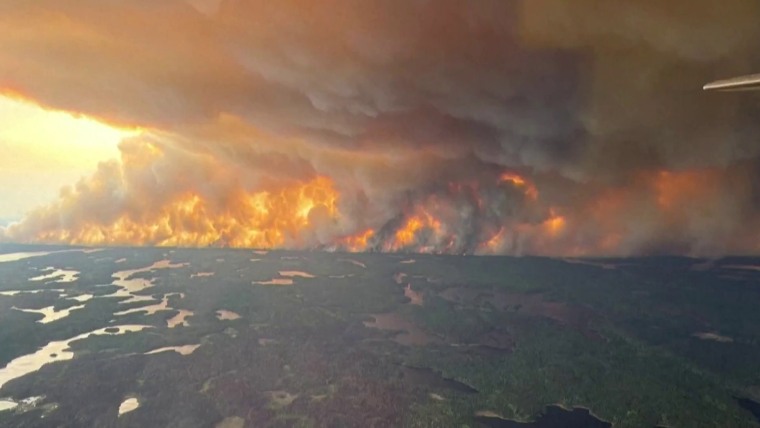
Ozone forms near the ground when pollutants and some natural compounds react with sunlight, heat, and wildfire smoke. Air pollution emitted by transportation, including diesel trucks, trains, planes, and cars, as well as refineries and power plants, were identified as the main causes of ozone pollution by the American Lung Association.
Minimize ozone exposure
Ozone levels vary day to day. An easy way to check current conditions is by using the Air Quality Index from the Environmental Protection Agency. The tool gives an immediate color-coded indication of air quality and can also be used to help avoid fine particle pollution. Additionally, the free AirVisual app displays real-time data from sensors located throughout the world and provides air-quality alerts, forecasts, and health recommendations by location. The Los Angeles region and L.A. Unified School District are part of the network.
What should I do when the air quality is bad?
- Spend more time indoors, where ozone levels are usually lower.
- Plan outdoor activities at times when ozone levels are lower (usually in the morning and evening).
- Choose easier outdoor activities (like walking instead of running) so you don’t breathe as hard.
How to find air quality information at your child’s school
Every school within the Los Angeles Unified School District has an air quality network sensor within about 1.6 miles. Even if your child doesn’t attend a school in the district, you can use the interactive tool to determine air quality by looking at data from the sensors nearest to your child’s daycare or school. You can also download the free AirVisual app, which displays all of the LAUSD sensors. The devices measure the concentration of fine particles in the air and do not measure greenhouse gases or other toxic air contaminants. School principals can restrict outdoor activities if air quality is poor, but only the superintendent has the authority to close a school, according to the district.
SDGs, Targets, and Indicators
1. Which SDGs are addressed or connected to the issues highlighted in the article?
- SDG 3: Good Health and Well-being
- SDG 11: Sustainable Cities and Communities
- SDG 13: Climate Action
2. What specific targets under those SDGs can be identified based on the article’s content?
- SDG 3.9: By 2030, substantially reduce the number of deaths and illnesses from hazardous chemicals and air, water, and soil pollution and contamination.
- SDG 11.6: By 2030, reduce the adverse per capita environmental impact of cities, including by paying special attention to air quality and municipal and other waste management.
- SDG 13.1: Strengthen resilience and adaptive capacity to climate-related hazards and natural disasters in all countries.
3. Are there any indicators mentioned or implied in the article that can be used to measure progress towards the identified targets?
- Indicator for SDG 3.9: Number of deaths and illnesses attributed to air pollution.
- Indicator for SDG 11.6: Air quality index and levels of particulate matter in cities.
- Indicator for SDG 13.1: Reduction in ozone pollution levels and improvement in air quality.
Table: SDGs, Targets, and Indicators
| SDGs | Targets | Indicators |
|---|---|---|
| SDG 3: Good Health and Well-being | 3.9: By 2030, substantially reduce the number of deaths and illnesses from hazardous chemicals and air, water, and soil pollution and contamination. | Number of deaths and illnesses attributed to air pollution. |
| SDG 11: Sustainable Cities and Communities | 11.6: By 2030, reduce the adverse per capita environmental impact of cities, including by paying special attention to air quality and municipal and other waste management. | Air quality index and levels of particulate matter in cities. |
| SDG 13: Climate Action | 13.1: Strengthen resilience and adaptive capacity to climate-related hazards and natural disasters in all countries. | Reduction in ozone pollution levels and improvement in air quality. |
Copyright: Dive into this article, curated with care by SDG Investors Inc. Our advanced AI technology searches through vast amounts of data to spotlight how we are all moving forward with the Sustainable Development Goals. While we own the rights to this content, we invite you to share it to help spread knowledge and spark action on the SDGs.
Fuente: laist.com

Join us, as fellow seekers of change, on a transformative journey at https://sdgtalks.ai/welcome, where you can become a member and actively contribute to shaping a brighter future.


