Report on Spatiotemporal Climatic Signals in Ethiopian Cereal Yields (1995-2018) and Implications for Sustainable Development Goals
Executive Summary
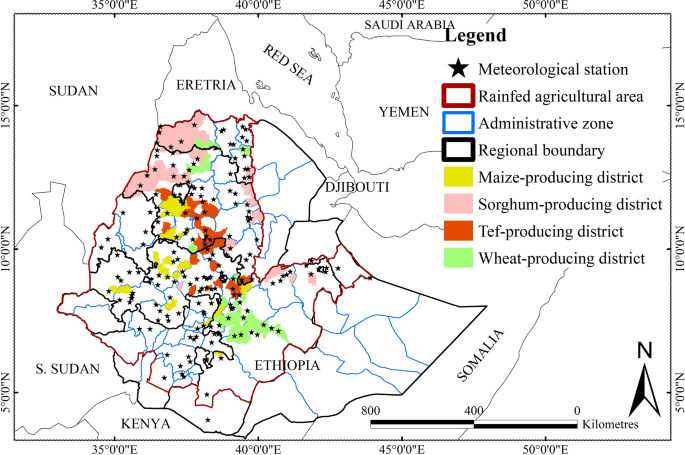
This report analyzes the spatiotemporal variability of key cereal crop yields (maize, sorghum, tef, and wheat) in Ethiopia from 1995 to 2018, examining their relationship with climatic and non-climatic factors. The analysis is framed within the context of the United Nations Sustainable Development Goals (SDGs), particularly SDG 2 (Zero Hunger), SDG 13 (Climate Action), and SDG 9 (Industry, Innovation, and Infrastructure). Findings indicate that while climatic trends, such as rising temperatures, present a measurable threat to agricultural productivity, their overall impact on national yield trends has been modest compared to the dominant, positive influence of technological advancements. This underscores the critical importance of integrating climate-resilient agricultural policies with continued investment in innovation to achieve food security and sustainable development in Ethiopia.
1. Introduction: Agriculture, Climate Change, and the Sustainable Development Agenda
Achieving food security is a cornerstone of the 2030 Agenda for Sustainable Development, encapsulated in SDG 2 (Zero Hunger). In Ethiopia, where rainfed agriculture is the primary source of livelihood and sustenance, this goal is directly threatened by climate change, making robust climate action (SDG 13) essential. Climatic variability, particularly recurrent drought and rising temperatures, poses a significant risk to crop production, thereby jeopardizing progress towards SDG 1 (No Poverty) and national economic stability. This report investigates the complex interplay between climatic trends, technological progress, and crop yields to provide insights for developing integrated, climate-resilient pathways that support Ethiopia’s sustainable development objectives.
1.1. Research Objectives
- To examine the spatiotemporal trends of climatic variables and the yields of four major cereal crops in Ethiopia.
- To quantify the relationship between observed crop yield variability and climatic variations.
- To determine the respective contributions of climatic trends and non-climatic factors (e.g., technology) to changes in crop yields.
- To provide actionable insights for designing crop- and location-specific adaptation strategies aligned with the SDGs.
2. Methodology
A multiple linear regression model was applied to analyze spatiotemporal data from 1995–2018. The study focused on Ethiopia’s primary administrative zones (AZs) and districts.
2.1. Data Sources
- Crop Yield Data: Annual yields for maize, sorghum, tef, and wheat were obtained from the Ethiopian Central Statistical Agency (CSA).
- Climate Data: Daily and monthly records for air temperature and precipitation were sourced from the Ethiopian National Meteorological Agency (NMA). Solar radiation data were derived from the NCEP DOE-II reanalysis dataset.
2.2. Analytical Approach
A linear mixed-effects model was employed to distinguish the impacts of climatic variables (temperature, precipitation, solar radiation) from non-climatic drivers, which were proxied by a temporal trend representing technological advancements. This approach allowed for the quantification of each factor’s contribution to yield variability and trends, providing a nuanced understanding of the forces shaping Ethiopian agriculture and its capacity to meet SDG 2.
3. Key Findings
3.1. Climatic Trends (1995-2018)
- Temperature: A significant warming trend was observed across most crop-growing regions, with an average national increase of +0.31°C per decade. This warming trend is a direct challenge to SDG 13 (Climate Action) and increases heat stress on agricultural systems.
- Precipitation: Precipitation trends were not statistically significant across most regions, exhibiting high spatial and interannual variability. This unpredictability complicates agricultural planning and threatens the stability required to achieve SDG 2.
3.2. Crop Yield Trends and Variability
- Yields for all four major cereals—maize, sorghum, tef, and wheat—generally increased across most growing areas, particularly in western Ethiopia.
- Maize yields saw the largest average increase (154.4 kg/ha/year), while wheat exhibited the highest interannual variability.
- Despite positive trends, high yield variability remains a significant challenge, indicating underlying vulnerabilities in the food system that must be addressed to ensure consistent progress towards SDG 2.
3.3. Disentangling Climatic and Non-Climatic Impacts on Yields
3.3.1. Impact of Climatic Trends
The net impact of long-term climatic trends on national crop yields was relatively small, masking significant regional and crop-specific effects.
- Maize: Negatively impacted, with an average national yield decrease of 3.2% attributed to climate trends. In some administrative zones, climate-induced losses were as high as -39.2%, highlighting severe localized vulnerability.
- Sorghum, Tef, and Wheat: Positively impacted, with climate trends contributing to small average yield increases of 0.6%, 0.2%, and 0.7%, respectively.
These findings demonstrate that climate change (SDG 13) is already creating winners and losers within Ethiopia’s agricultural sector, necessitating targeted adaptation strategies.
3.3.2. Dominant Role of Non-Climatic Factors
Technological advancements emerged as the primary driver of yield gains, significantly outweighing the net effects of climate change at the national level. This highlights the power of SDG 9 (Innovation) in building agricultural resilience.
- Technological progress contributed to annual yield increases ranging from 4.3% for wheat to 5.1% for sorghum.
- These gains, attributed to factors like improved cultivars, better agronomic practices, and enhanced input use, have been instrumental in advancing SDG 2 (Zero Hunger) by offsetting some of the negative pressures from climate variability.
4. Discussion and Implications for Sustainable Development
The analysis reveals a critical dynamic in Ethiopia’s pursuit of the Sustainable Development Goals: a race between agricultural innovation and the escalating impacts of climate change. While investments in technology have successfully driven yield growth, thereby supporting SDG 2, the negative impacts of climate change are evident, particularly for maize, a staple food crop. The high spatial variability of these impacts underscores that national-level policies must be complemented by localized, context-specific interventions.
To build a truly sustainable and resilient food system, Ethiopia must accelerate efforts under SDG 13 (Climate Action) by promoting climate-smart agriculture. This includes diversifying cropping systems away from vulnerable staples like maize in high-risk areas and promoting drought-tolerant crops like sorghum. Furthermore, continued investment in research and infrastructure, as called for by SDG 9, is essential to maintain the momentum of technological progress that has so far been critical to ensuring food availability.
5. Conclusion and Recommendations
This report concludes that while climate change poses a tangible threat to Ethiopian agriculture, non-climatic factors, primarily technological advancements, have been the dominant driver of cereal yield increases between 1995 and 2018. However, the adverse effects of climate are significant at local levels and for specific crops, signaling a clear need for proactive adaptation.
5.1. Policy Recommendations for Achieving the SDGs
- Integrate Climate Action with Food Security Policy (SDG 13 & SDG 2): Develop and implement crop- and location-specific adaptation strategies that promote climate-resilient varieties and water-management practices, especially in regions showing high vulnerability.
- Strengthen Investment in Agricultural Innovation (SDG 9 & SDG 2): Sustain and enhance public and private investment in agricultural research, extension services, and rural infrastructure to ensure that technological gains continue to outpace the negative impacts of climate change.
- Enhance Data Monitoring for Evidence-Based Policy: Improve the collection and analysis of localized climate and agricultural data to better understand crop-specific vulnerabilities and tailor interventions that support smallholder farmers, thereby advancing SDG 1 (No Poverty) and SDG 2 (Zero Hunger).
Analysis of Sustainable Development Goals in the Article
1. Which SDGs are addressed or connected to the issues highlighted in the article?
-
SDG 2: Zero Hunger
The article’s primary focus is on food security in Ethiopia, directly aligning with SDG 2. It analyzes the yields of major staple crops (maize, sorghum, tef, and wheat), investigates the factors affecting their production, such as climatic variability and technology, and discusses the implications for national food production. The introduction explicitly states, “Food security has become a global policy and is an important goal of sustainable development.”
-
SDG 13: Climate Action
The core of the article is an investigation into the impacts of climate change and variability on agriculture. It examines trends in temperature and precipitation and quantifies their effect on crop yields. The analysis aims to provide “actionable insights for designing crop- and location-specific adaptation strategies, and stress the need for integrated, climate-resilient development pathways,” which is central to SDG 13.
-
SDG 1: No Poverty
The article connects agricultural productivity and climate shocks to the livelihoods of smallholder farmers. In the discussion, it notes that in Ethiopia, “agriculture is predominantly smallholder-based” and that “Minor climatic shocks in these areas can lead to crop failure… and ultimately contribute to food insecurity,” which is a primary driver of poverty. This links the research to the goal of reducing poverty and building the resilience of vulnerable populations.
-
SDG 15: Life on Land
The discussion section touches upon land management practices as a non-climatic factor influencing crop productivity. It mentions issues like “soil degradation” and government interventions such as “land-rehabilitation programmes” and “widespread adoption of practices for conserving soil and water.” These actions are directly related to the goal of halting and reversing land degradation.
2. What specific targets under those SDGs can be identified based on the article’s content?
-
Under SDG 2 (Zero Hunger):
- Target 2.3: By 2030, double the agricultural productivity and incomes of small-scale food producers. The article directly addresses this by analyzing trends in crop yields (a measure of productivity) and identifying the drivers of these trends, such as “technological advancements,” which “contributed substantially more to yield gains, with annual increases ranging from 4.3% for wheat to 5.1% for sorghum.”
- Target 2.4: By 2030, ensure sustainable food production systems and implement resilient agricultural practices that increase productivity and production, that help maintain ecosystems, that strengthen capacity for adaptation to climate change, extreme weather, drought, flooding and other disasters and that progressively improve land and soil quality. The entire study is framed around understanding the impacts of climate variability to implement “adequate adaptive measures” and design “climate-resilient development pathways.” It analyzes the sensitivity of the rainfed cropping system to drought and climatic variability, which is key to building resilient agricultural practices.
-
Under SDG 13 (Climate Action):
- Target 13.1: Strengthen resilience and adaptive capacity to climate-related hazards and natural disasters in all countries. The article’s analysis of how temperature and precipitation trends affect crop yields is a direct assessment of vulnerability. Its conclusion emphasizes the need for “crop- and location-specific policies and strategies that encourage resilient agricultural practices capable of withstanding the impacts of climatic variability and change” to enhance adaptive capacity.
-
Under SDG 1 (No Poverty):
- Target 1.5: By 2030, build the resilience of the poor and those in vulnerable situations and reduce their exposure and vulnerability to climate-related extreme events and other economic, social and environmental shocks and disasters. The article highlights that Ethiopia’s agriculture is “mainly by small-scale subsistence farming” and that “spatiotemporal variability in precipitation and associated droughts is cause of food insecurity.” By analyzing the impacts of these climate shocks on crop yields, the study addresses the vulnerability of this population.
-
Under SDG 15 (Life on Land):
- Target 15.3: By 2030, combat desertification, restore degraded land and soil, including land affected by desertification, drought and floods, and strive to achieve a land degradation-neutral world. The article refers to historical “soil degradation and drought in northern Ethiopia” and mentions countermeasures like “land-rehabilitation programmes” and “practices for conserving soil and water” as important non-climatic factors that have helped increase crop production.
3. Are there any indicators mentioned or implied in the article that can be used to measure progress towards the identified targets?
-
Indicators for SDG 2 Targets:
- Crop yield per hectare (kg/ha): The article provides extensive data on the yields of maize, sorghum, tef, and wheat from 1995-2018. For example, it states, “national yield levels increased by 27% for maize, 22% for sorghum, 26% for tef, and 24% for wheat.” This directly measures agricultural productivity (Target 2.3).
- Annual rate of yield increase (kg/ha/year): The study quantifies the progress in productivity over time, stating that “maize yields increased by an average of 154.4 kg/ha/year.” This serves as a direct indicator of productivity gains (Target 2.3).
- Yield variability (Coefficient of Variation – CV): The article uses CV to measure the stability and resilience of crop production. It notes, “Wheat yield variability was the highest among all crops (CV range: 0.19–0.67).” Lower variability would indicate more resilient systems (Target 2.4).
- Contribution of technology to yield growth (% per year): The study isolates the impact of non-climatic factors, stating that “technological advancements contributed substantially more to yield gains, with annual increases ranging from 4.3% for wheat to 5.1% for sorghum.” This measures the adoption and success of productive agricultural practices (Target 2.3).
-
Indicators for SDG 13 and SDG 1 Targets:
- Impact of climatic trends on crop yield (% change): The article quantifies the vulnerability of the agricultural system to climate change. For instance, “On average at the country level, the climatic trends contributed to ‒3.2% for maize.” This measures the extent of climate-related hazards on the primary livelihood of the poor and vulnerable (Targets 13.1 and 1.5).
- Proportion of yield variability explained by climate variability (%): This indicator measures the sensitivity of agriculture to climate shocks. The article finds that “climatic variability accounted for significant variations in crop yields across the main growing areas, encompassing 45, 40, 49, and 37% of the areas for growing maize, sorghum, tef and wheat, respectively.” A reduction in this percentage could indicate increased resilience (Targets 13.1 and 1.5).
-
Indicators for SDG 15 Target:
- Adoption of soil and water conservation practices: While not quantified with a specific number, the article mentions the “widespread adoption of practices for conserving soil and water” as a key intervention. Tracking the area covered by such practices would be a direct indicator of progress toward restoring degraded land (Target 15.3).
4. Table of SDGs, Targets, and Indicators
| SDGs | Targets | Indicators Identified in the Article |
|---|---|---|
| SDG 2: Zero Hunger |
2.3: Double agricultural productivity and incomes of small-scale food producers.
2.4: Ensure sustainable food production systems and implement resilient agricultural practices. |
|
| SDG 13: Climate Action | 13.1: Strengthen resilience and adaptive capacity to climate-related hazards and natural disasters. |
|
| SDG 1: No Poverty | 1.5: Build the resilience of the poor and vulnerable to climate-related shocks and disasters. |
|
| SDG 15: Life on Land | 15.3: Combat desertification, restore degraded land and soil. |
|
Source: nature.com


