

The Problem—Increasing Air Pollution in Cities in the mid-1900’s
After World War II, economic growth, population growth, rapid suburbanization, and the closing of some public transit systems led to more reliance on personal vehicles for transportation. The number of cars and trucks in the United States increased dramatically, as did the number of highways. One result of the rapid increase of motor vehicles was air pollution, especially in cities, that had serious impacts on public health and the environment.
Historic Success of the Clean Air Act
Congress passed the landmark Clean Air Act in 1970 and gave the newly-formed EPA the legal authority to regulate pollution from cars and other forms of transportation. EPA and the State of California have led the national effort to reduce vehicle pollution by adopting increasingly stringent standards.
The U.S. vehicle pollution control under the Clean Air Act is a major success story by many measures:
- New passenger vehicles are 98-99% cleaner for most tailpipe pollutants compared to the 1960s.
- Fuels are much cleaner—lead has been eliminated, and sulfur levels are more than 90% lower than they were prior to regulation.
- U.S. cities have much improved air quality, despite ever increasing population and increasing vehicle miles traveled.
- Standards have sparked technology innovation from industry.
Reducing pollution from transportation sources has led to healthier air for Americans. In cities, smog has been visibly reduced. Just compare the images of New York City below.
New York City: 1973 vs. 2013.
Slide the arrows to compare.
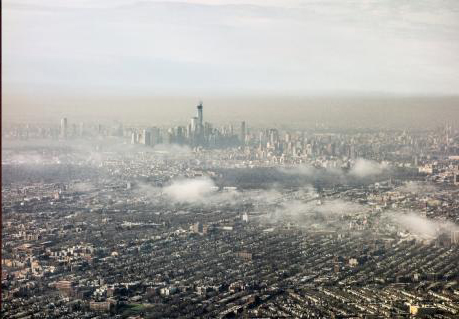

Source: EPA Documerica “Then and Now Challenge”
Pollution from vehicles, engines, and fuels dramatically reduced while achieving economic growth
Over forty years of clean air policies have improved air quality and improved the health of Americans, and the environment. Since 1970, EPA has set and implemented emissions standards to control pollution from everything from passenger vehicles, heavy duty trucks and buses, construction and farm equipment, locomotive and marine engine and even lawn and garden equipment. These standards are a critical part of the progress and improved air quality we have achieved despite increased economic activity and more miles traveled on average per person.
Cleaner Cars, Trucks, and Fuels
Compared to 1970 vehicle models, new cars, SUVs and pickup trucks are roughly 99 percent cleaner for common pollutants (hydrocarbons, carbon monoxide, nitrogen oxides and particle emissions). New heavy-duty trucks and buses are roughly 99 percent cleaner than 1970 models.
Lead Removed from Gasoline
Motor vehicles were once the major contributor of lead emissions. EPA began to phase out lead in gasoline starting in the 1970’s and leaded gasoline was fully prohibited after 1995. As a result, levels of lead in the air decreased by 94 percent between 1980 and 1999.
Spurring Innovation in Cleaner Cars, Trucks, and Fuels
EPA vehicle emissions standards directly sparked the development and implementation of a range of technologies.The automotive catalytic converter, in particular is considered to be one of the great environmental inventions of all time.
Emissions standards led to the adoption of many modern automotive technologies—computers, fuel injection, and on-board diagnostics—resulting in cars that are not only much cleaner, but also higher quality, more reliable, and more durable.
The vehicle emissions control industry employs approximately 65,000 Americans with domestic annual sales of $26 billion1.
1https://www.epa.gov/clean-air-act-overview/clean-air-act-and-economy#technology
Contributions to the U.S. Economy
Efforts to reduce air pollution from transportation have proven to be cost effective. For every one dollar spent on programs to reduce emissions, the American people receive nine dollars of benefits to public health and the environment.
Timeline of Major Accomplishments
Air pollution and cars were first linked in the early 1950’s by a California researcher who determined that pollutants from traffic was to blame for the smoggy skies over Los Angeles. At the time, typical new cars were emitting nearly 13 grams per mile hydrocarbons (HC), 3.6 grams per mile nitrogen oxides (NOx), and 87grams per mile carbon monoxide (CO). Since then, the U.S. Environmental Protection Agency (EPA) has set standards to bring down levels of these pollutants, and the auto industry has responded by developing new emission control technologies.
The Road Ahead
Despite our successes, many places in the United States still have poor local air quality and there is more to be done. EPA is now taking on the critical challenge of climate change. Carbon pollution from burning fossil fuels is rapidly changing the earth’s climate. The transportation sector is one of the largest sources of carbon pollution in the U.S. EPA has set carbon emissions standards for passenger cars and trucks, onroad heavy duty trucks and buses, and is now working to develop standards for aircraft.
Learn more about EPA’s current standards and programs to reduce pollution from transportation:
SDGs, Targets, and Indicators
-
SDG 3: Good Health and Well-being
- Target 3.9: By 2030, substantially reduce the number of deaths and illnesses from hazardous chemicals and air, water, and soil pollution and contamination.
- Indicator: Reduction in air pollution levels in cities.
-
SDG 11: Sustainable Cities and Communities
- Target 11.6: By 2030, reduce the adverse per capita environmental impact of cities, including by paying special attention to air quality and municipal and other waste management.
- Indicator: Improvement in air quality in cities.
-
SDG 13: Climate Action
- Target 13.1: Strengthen resilience and adaptive capacity to climate-related hazards and natural disasters in all countries.
- Indicator: Reduction in carbon emissions from transportation.
Table: SDGs, Targets, and Indicators
| SDGs | Targets | Indicators |
|---|---|---|
| SDG 3: Good Health and Well-being | Target 3.9: By 2030, substantially reduce the number of deaths and illnesses from hazardous chemicals and air, water, and soil pollution and contamination. | Reduction in air pollution levels in cities. |
| SDG 11: Sustainable Cities and Communities | Target 11.6: By 2030, reduce the adverse per capita environmental impact of cities, including by paying special attention to air quality and municipal and other waste management. | Improvement in air quality in cities. |
| SDG 13: Climate Action | Target 13.1: Strengthen resilience and adaptive capacity to climate-related hazards and natural disasters in all countries. | Reduction in carbon emissions from transportation. |
Analysis
The article addresses several Sustainable Development Goals (SDGs) related to air pollution and transportation. The specific SDGs are:
- SDG 3: Good Health and Well-being – This SDG is connected to the issue of air pollution, which has serious impacts on public health. The target under this SDG is to reduce the number of deaths and illnesses from hazardous chemicals and air pollution. The article mentions that reducing pollution from transportation sources has led to healthier air for Americans, indicating progress towards this target. The indicator is the reduction in air pollution levels in cities, as mentioned in the article.
- SDG 11: Sustainable Cities and Communities – This SDG is connected to the issue of air pollution in cities. The target under this SDG is to reduce the adverse per capita environmental impact of cities, including air quality. The article mentions that U.S. cities have much improved air quality, despite increasing population and vehicle miles traveled, indicating progress towards this target. The indicator is the improvement in air quality in cities, as mentioned in the article.
- SDG 13: Climate Action – This SDG is connected to the issue of carbon pollution from transportation. The target under this SDG is to strengthen resilience and adaptive capacity to climate-related hazards. The article mentions that the transportation sector is one of the largest sources of carbon pollution in the U.S., indicating the need for action to reduce carbon emissions. The indicator is the reduction in carbon emissions from transportation, which is implied in the article.
Based on the analysis of the article, the table presents the identified SDGs, targets, and indicators related to the issues discussed.
Behold! This splendid article springs forth from the wellspring of knowledge, shaped by a wondrous proprietary AI technology that delved into a vast ocean of data, illuminating the path towards the Sustainable Development Goals. Remember that all rights are reserved by SDG Investors LLC, empowering us to champion progress together.
Source: epa.gov
![]()
Join us, as fellow seekers of change, on a transformative journey at https://sdgtalks.ai/welcome, where you can become a member and actively contribute to shaping a brighter future.


